


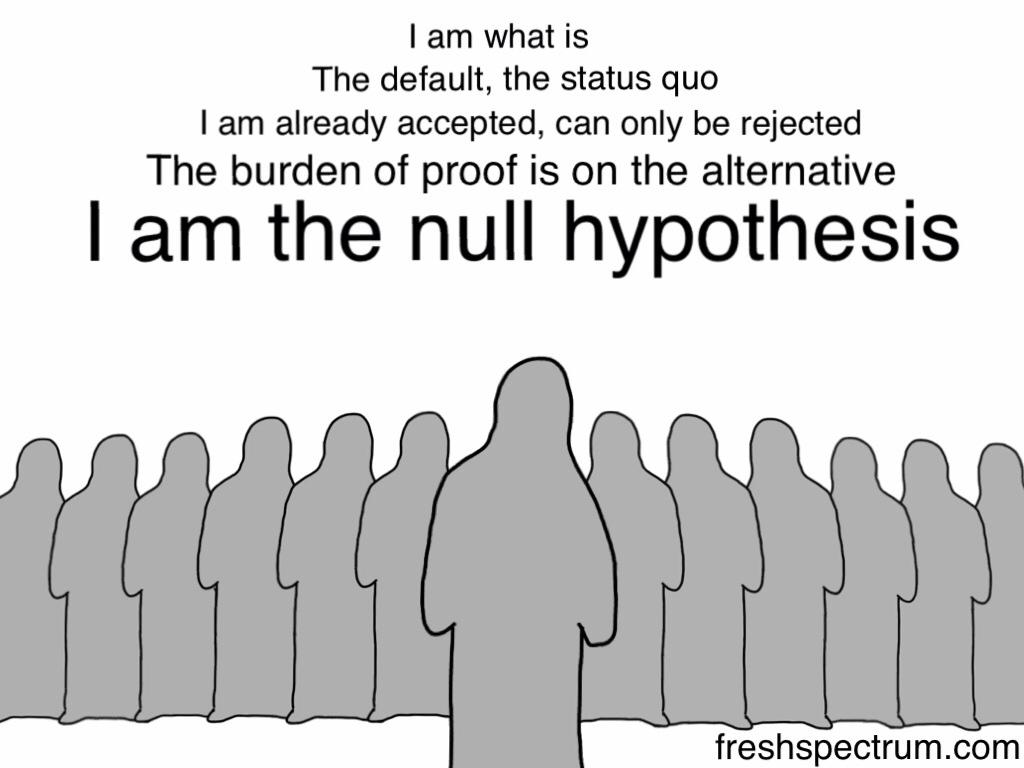
Hypothesis Testing Explained: A Beginner’s Guide to Data-Driven Decisions
Imagine this: You’re trying to decide if a new workout routine actually burns more calories than your current one. Or maybe you're a business owner debating whether a fresh ad campaign will lead to more sales. How do you decide what’s worth the leap? That’s where hypothesis testing swoops in like your data-driven hero.
At its core, hypothesis testing is the art of asking bold questions and using data to figure out if you're onto something big or just chasing noise. You start with a guess (your hypothesis), collect the facts, and then test those facts to see if they back you up or laugh in your face. The real genius of hypothesis testing lies in its ability to turn uncertainty into clarity, making it indispensable in fields like science, business, and even social media experiments.
This guide will break down what hypothesis testing is, why it’s a game-changer, and how you can use it for better decision-making. From step-by-step processes to juicy real-world examples, you’ll see why this statistical tool isn’t just for scientists in lab coats.
What’s All the Fuss about Hypothesis Testing?
Let’s be honest: when most people think of statistics, their minds probably wander to dreary lectures, long equations, and endless numbers. But tucked within this world of numbers is something that drives major decisions in business, politics, medicine, and beyond. Hypothesis testing is the unsung hero behind the curtain, helping us make sense of the messiness of life by using data to prove (or disprove) what we think we know.
In its simplest form, hypothesis testing is the process of asking: “Does the data support my theory?” It’s not just for statisticians—it’s used to answer questions like, “Does this new drug actually work?” or “Is my marketing campaign really making a difference?” Without hypothesis testing, we’re just guessing. And while guessing can sometimes be fun (see: Vegas), when it comes to crucial decisions, we need something better.
The Basics of Hypothesis Testing
Before we dive into the cool stuff, let’s go over the basics. In hypothesis testing, there are two types of hypotheses: the null hypothesis and the alternative hypothesis. The null hypothesis (often denoted as H₀) essentially says, “Nothing special is happening here. The status quo remains unchanged.” The alternative hypothesis (H₁ or Ha), on the other hand, says, “Something interesting is going on. We have evidence of a change or effect.”
Let’s simplify: imagine you’re trying to figure out if a new advertising campaign increases sales. The null hypothesis would claim that the new campaign has no effect, while the alternative hypothesis would suggest that it does. From there, it’s a matter of gathering data, running tests, and making a decision.
Null Hypothesis: The “Default”
Meet the null hypothesis, the unsung underdog of hypothesis testing. If hypothesis testing were a stage play, the null hypothesis would be the quiet understudy, always standing in the background, waiting for the lead to fail. Most of the time, we expect the null hypothesis to be true—after all, it represents the idea that there’s no effect, no difference, no change. It's the default position we start with.
So why is it so important? Well, the null hypothesis is the foundation of the whole testing process. We’re essentially trying to “reject” it—proving that something out of the ordinary is happening. Rejecting the null hypothesis doesn’t mean we’re throwing out the baby with the bathwater; it simply means we have enough evidence to believe that there’s something worth investigating.
Alternative Hypothesis: The Challenger
Now, here comes the flashy part: the alternative hypothesis. If the null hypothesis is the quiet understudy, the alternative hypothesis is the ambitious lead actor, looking to grab the spotlight. This is the hypothesis that suggests something exciting is going on: a new trend, a major difference, or a groundbreaking effect.
The alternative hypothesis is what researchers, businesses, and politicians get excited about. It’s the "what if" scenario—the answer to the big question that’s been lurking in the background. Is your new marketing campaign effective? Is your vaccine working as promised? The alternative hypothesis answers these big questions, and it’s the one you’re hoping to validate.
The Key Steps in Hypothesis Testing
In the world of data and decision-making, hypothesis testing is like a courtroom drama. The evidence (your data) is presented, the judge (you, the researcher) weighs the facts, and a verdict is reached—only it’s a bit more statistical than moral. Let’s break down the critical steps in this process, each one a key player in determining whether the truth (or at least the most plausible truth) is on your side.
Step 1: Formulate Hypotheses
Before you start crunching numbers, you need to make a claim. This is where the magic of hypothesis testing begins. Think of it like arguing two sides of a debate: you’re either saying, “I believe this is true,” or “Nope, I think the opposite is true.”
- Null Hypothesis (H₀): This is your starting point—the “no effect” or “no difference” position. It’s like saying, “There’s no evidence here to suggest anything out of the ordinary.” In a way, H₀ is the default position of skepticism. For instance, you might hypothesize that a new drug has no impact on recovery time.
- Alternative Hypothesis (H₁): This is the challenger. It’s what you suspect could be true—the statement that contradicts the null. In our drug example, the alternative hypothesis would be, “This drug does reduce recovery time.”
Now, here’s the catch: researchers often hope to reject the null hypothesis. But we never just believe the alternative hypothesis is true; instead, we seek evidence to disprove the null.
Step 2: Choose a Significance Level (α)
This is where things start to get a little more technical, but it’s an important step to keep things grounded. The significance level, denoted as α, is the threshold at which you’re willing to reject the null hypothesis. Think of it as a bar you set for your evidence.
- The most common α value is 0.05. In plain language, you’re saying, “I’m willing to accept a 5% chance that I’m wrong about rejecting the null hypothesis.” That’s a pretty small risk, right? But it’s not zero. In some fields, researchers may go as low as 0.01 to be more cautious.
Why does this matter? If your results give a p-value (more on that later) lower than α (let’s say 0.03), you might say, “Ah, the evidence is strong enough for me to reject H₀.” But if it’s higher than 0.05, you’d stick with the null hypothesis, saying, “Not enough evidence to convince me.”
Step 3: Select the Appropriate Test
Now that you’ve got your hypotheses and significance level in place, it’s time to pick the right statistical tool for the job. This is where you choose your weapon of choice, depending on the type of data you’re dealing with. There’s a whole arsenal of statistical tests out there, and each one is designed for specific situations. Here are a few of the big hitters:
- t-test: If you’re comparing the means of two groups (e.g., the average income of two neighbourhoods), this is your go-to. A t-test answers, “Is the difference in means statistically significant, or could it be due to random chance?”
- Chi-square test: When your data is categorical (think yes/no answers or preferences between types of products), the chi-square test looks at how the observed frequencies deviate from what you would expect by chance.
- ANOVA (Analysis of Variance): This is your test if you have more than two groups to compare (e.g., income across three different cities). It extends the t-test into multiple group comparisons, answering the question, “Are the means of all these groups significantly different from each other?”
It’s not a one-size-fits-all situation, so knowing which test to pick is a crucial decision. Get it wrong, and your conclusions might be as faulty as a bad GPS route.
Step 4: Calculate the Test Statistic
Here’s where the math nerds (and their calculators) come into play. A test statistic is just a number that summarizes the data in a way that allows us to compare it to what we would expect under the null hypothesis. The beauty of this is that it gives us a metric for how far away our observed data is from the “no effect” position.
- t-statistic: If you're using a t-test, for example, the t-statistic tells you how many standard deviations your sample mean is away from the hypothesized population mean. The bigger this number, the more unusual your result is.
- z-score: If you're dealing with a large sample size, the z-score is a similar idea to the t-statistic, but it assumes the sample data follows a normal distribution. If your data is further away from the expected mean, the z-score will reflect this.
The test statistic is your way of quantifying the "odds" that your result is due to random chance. The higher the number, the more confident you can be that the null hypothesis is not holding up under scrutiny.
Step 5: Make a Decision
This is where you, the judge, come to a verdict. You’ve done the legwork: calculated the test statistic, compared it to the critical value, and now it's time to check the p-value.
- P-value: This is the probability of observing a result at least as extreme as the one you found, assuming the null hypothesis is true. In essence, the p-value is like the probability that you're making a Type I error—rejecting a null hypothesis that’s actually correct.
- If your p-value is less than α (say, 0.03 < 0.05), you can reject the null hypothesis. You’ve got enough evidence to say, “It’s unlikely that this result happened by chance alone. The alternative hypothesis seems more plausible.”
- If the p-value is greater than α (say, 0.08 > 0.05), you don’t have enough evidence to reject the null hypothesis. So, you stick with the idea that there’s no significant effect or difference.
But here’s the kicker: the p-value isn’t the final word on whether your hypothesis is “true” or not. It’s simply a tool to help you make an informed decision about the data, with uncertainty always lurking in the background. This is the humbling nature of hypothesis testing: no result is ever entirely conclusive.
Example: Testing a New Classroom Method
Let’s say a school district introduces a new teaching method to improve student test scores, and they want to test whether this new method is more effective than the traditional teaching method. The district decides to compare the test scores of students who are taught using the new method versus those taught using the traditional method.
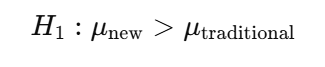
Step 1: Formulate Hypotheses
- Null Hypothesis (H₀): The new teaching method does not improve test scores compared to the traditional method. (i.e., the average score of students using the new method is the same as the average score of students using the traditional method.)
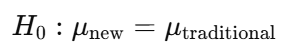
- Alternative Hypothesis (H₁): The new teaching method does improve test scores compared to the traditional method. (i.e., the average score of students using the new method is higher than the average score of students using the traditional method.)
Step 2: Choose a Significance Level (α)
Let’s set the significance level to α = 0.05, which means that you’re willing to accept a 5% chance of rejecting the null hypothesis when it is actually true (Type I error).
Step 3: Collect Data
Imagine that the district tests 30 students using the new method and 30 students using the traditional method. After taking the test, the average score of students in the new method group is 85, and the average score of students in the traditional method group is 80. The standard deviation of scores for both groups is similar.
Step 4: Calculate the Test Statistic
In this case, you’d likely perform a t-test to compare the means of the two groups (assuming the data is normally distributed). The t-test will help you calculate the t-statistic, which measures how far apart the two sample means are, relative to the variability in the data.
You'd use the formula for a t-test to calculate this statistic, which would give you a number (let’s assume it’s 2.2). You would also calculate the p-value, which tells you the probability of obtaining a test statistic as extreme as the one you calculated if the null hypothesis were true.
Step 5: Make a Decision
- If the p-value is less than 0.05 (the significance level α), you would reject the null hypothesis and conclude that the new teaching method does have a significant effect on test scores (i.e., students in the new method group scored significantly higher).
- If the p-value is greater than 0.05, you fail to reject the null hypothesis, meaning that there is not enough evidence to suggest that the new teaching method improves test scores over the traditional method.
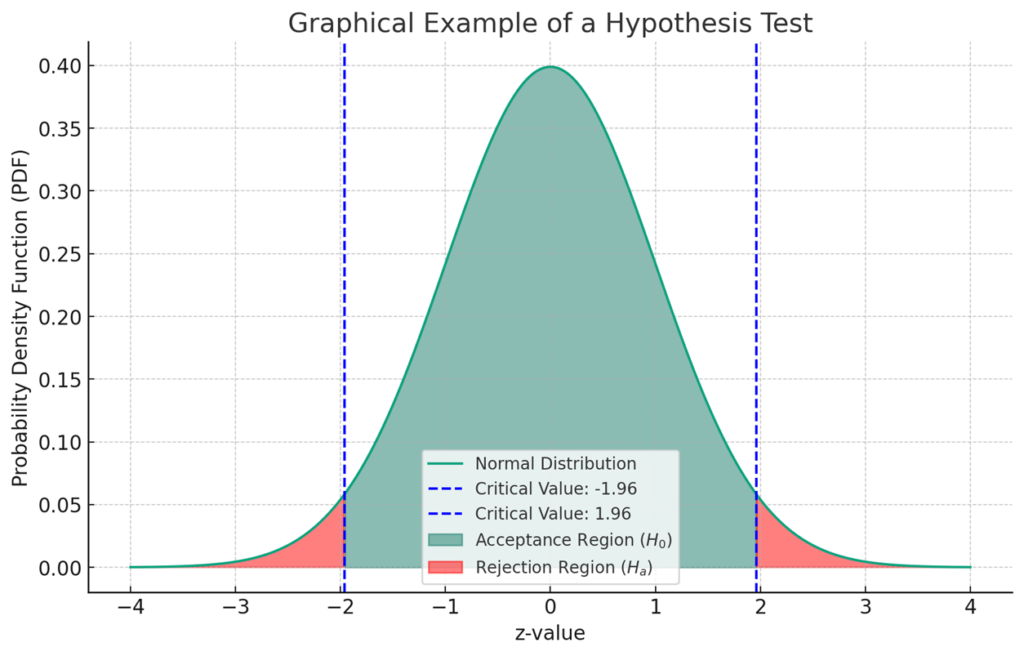
In the graph above, the red area represents the statistical significance which is 0.05 or 5% .
Confidence
Take a look at the above graph again.
Confidence Level
This represents how confident you are that the true population parameter lies within a given range (a confidence interval). For the example above, the population parameter is the population mean test score (before or after the teaching method is applied, depending on the setup). The null hypothesis assumes that the t-score or z-score of the population parameter is 0.
If the significance level is 0.05 (or 5%), this corresponds to a 95% confidence level, meaning we are 95% confident that the true population parameter lies within the confidence interval. For a two-tailed test with normal distribution, the test statistic should fall within the range of -1.96 to +1.96. If the test statistic falls outside this range, we would reject the null hypothesis.
Significance Level, Type 1 and Type 2 Errors
In the world of statistics, the significance level (α) is a little bit like the speed limit in a city. It's a threshold — a set point that dictates how far you're willing to go before saying, “Hey, something interesting is happening here!” Just like the speed limit tells you when you're driving too fast, the significance level tells you when the evidence against the null hypothesis is strong enough to reject it.
But here's the catch: setting this threshold is not as simple as it seems. In fact, it’s all about making a trade-off between two types of errors that could occur: Type I errors and Type II errors. These errors are the frenemies of statistics — you can't have one without potentially inviting the other. Let's break it down.
Significance Level (α): The Decision-Maker’s Dilemma
In hypothesis testing, the significance level is often set at 0.05, or 5%. This means that if you're conducting an experiment or analysis, you’re willing to accept a 5% chance of making a mistake when rejecting the null hypothesis — that is, you’re willing to incorrectly declare an effect or difference when there actually isn’t one. Think of it like deciding that a 5% risk of being wrong is a fair price to pay for uncovering new knowledge.
Now, you might be wondering: Why is it 5%? Why not 1% or 10%? The truth is, this level is more of a convention than a hard-and-fast rule, and it stems from the early days of statistical theory. Over time, 0.05 became the sweet spot, balancing risk with practicality. It’s low enough to minimize the risk of a false positive (Type I error), but high enough to allow researchers to uncover meaningful findings without throwing caution completely out the window.
But this 5% is a threshold — not an absolute guarantee. The confidence level (often 95%) is the mirror image of the significance level. If you set the significance level to 0.05, you are saying, “I’m 95% confident that if I make a claim, it will be correct.” The confidence level is just the flip side of the coin: it tells you how sure you are that the true value lies within a given range, while the significance level tells you how much risk you’re willing to take in making a conclusion.
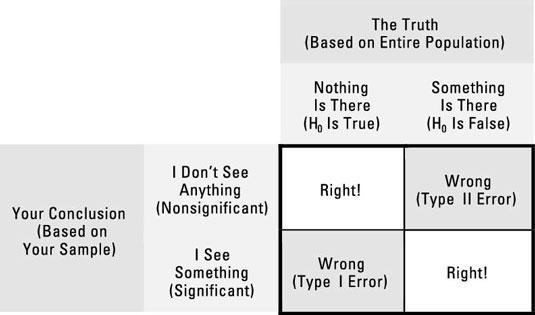
Type I vs. Type II Errors: A Delicate Balancing Act
Now comes the tricky part. While we’re setting that nice, neat 5% threshold, there’s something lurking beneath the surface: the trade-off between Type I error (false positives) and Type II error (false negatives). Think of it like trying to decide whether to send out a party invitation based on whether you’re sure people will show up.
- Type I Error (False Positive): This is like accusing someone of being guilty when they’re actually innocent. In statistical terms, it’s rejecting the null hypothesis when it is actually true. This is the “false alarm” of the statistical world. If you set your significance level too high (say, 0.10 or 10%), you’re increasing your risk of a Type I error — you’re more likely to reject the null hypothesis and claim an effect exists when, in reality, it does not. It’s like saying, “Yeah, let’s throw a party!” without really knowing if people will show up. Maybe you're overestimating how much interest there actually is.
- Type II Error (False Negative): On the flip side, a Type II error is like failing to invite someone to the party when they actually would’ve loved to come. In statistical terms, it’s failing to reject the null hypothesis when it is actually false. This happens when you’re too conservative, not setting your significance level low enough to detect an effect that truly exists. By tightening your significance threshold (e.g., setting it to 0.01), you reduce the risk of a Type I error, but you simultaneously increase the risk of Type II errors — missing out on a meaningful result that’s actually there. It’s like saying, “Let’s play it safe and assume nobody wants to come,” and, in doing so, you miss out on the perfect guests who would have added a lot to the party.
Here’s the catch: you can’t entirely eliminate both errors. You’re constantly balancing between being too eager to make conclusions and being too cautious to make any conclusions at all. If you want to reduce the chance of a Type I error (false positive), you lower the significance level (e.g., 0.01 instead of 0.05), but that makes you more likely to commit a Type II error (false negative). Alternatively, if you increase the significance level (say, 0.10), you might reduce Type II errors, but you'll be more prone to falsely claiming effects that don’t actually exist.
The Trade-off in Action: A Fine Line Between Confidence and Risk
In the real world, this trade-off isn’t theoretical — it’s a constant juggling act. Imagine you’re testing a new medical treatment. A Type I error means you might wrongly claim the treatment is effective when it’s not — potentially leading to costly and harmful decisions. On the other hand, a Type II error means you fail to notice that the treatment is effective, leaving patients without a beneficial option.
As a result, understanding the significance level and how it relates to errors is crucial in every field — from clinical trials to economic studies, and even marketing campaigns. The key is knowing what risks you are willing to take and how confident you need to be before making a claim or acting on data.
In the End, It’s All About Trade-offs
Ultimately, setting the significance level is about acknowledging that you can't have it all. You can’t completely eliminate the risk of error, but you can strategically manage it by understanding how confidence and risk interplay in your decision-making process. So, next time you’re setting your significance level, remember: you’re not just drawing a line in the sand; you’re making a decision about how much certainty and risk you’re willing to accept in the pursuit of knowledge.
Conclusion: Time to Test Your Hypotheses
Now that you’ve waded through the world of hypothesis testing, you’re ready to take on the next challenge. Understanding the significance level, balancing Type 1 and Type 2 errors, and making the right decisions based on data can be game-changers in everything from business strategy to groundbreaking research.
But here’s the thing: knowing the theory is just the beginning. The real magic happens when you put these concepts into practice. And while you might feel like you're stepping into the deep end of statistical analysis, you don’t have to do it alone.
Ready to dive deeper? If you’re looking to level up your data game and master hypothesis testing (along with all the other stats you’ll need), check out Skillcamper’s Statistics Course. It’s the perfect blend of theory, practical insights, and hands-on examples that’ll help you navigate the world of numbers like a pro. Whether you’re testing hypotheses in your research or making data-driven decisions in your business, this course has got you covered.
Don’t just sit on the sidelines — take control of your data and start making smarter, more informed decisions today. Check out Skillcamper’s Free Courses and turn those numbers into your next big breakthrough.
.jpeg)


.avif)

Lorem ipsum dolor sit amet, consectetur adipiscing elit. Suspendisse varius enim in eros elementum tristique. Duis cursus, mi quis viverra.